What is MLIR and Why Does It Matter?
Compiler infrastructure has historically been fragmented. You had one representation for the high-level language (like the TensorFlow graph) and a completely different one for the low-level machine code (like LLVM IR). Moving between these levels often resulted in lost optimization opportunities.
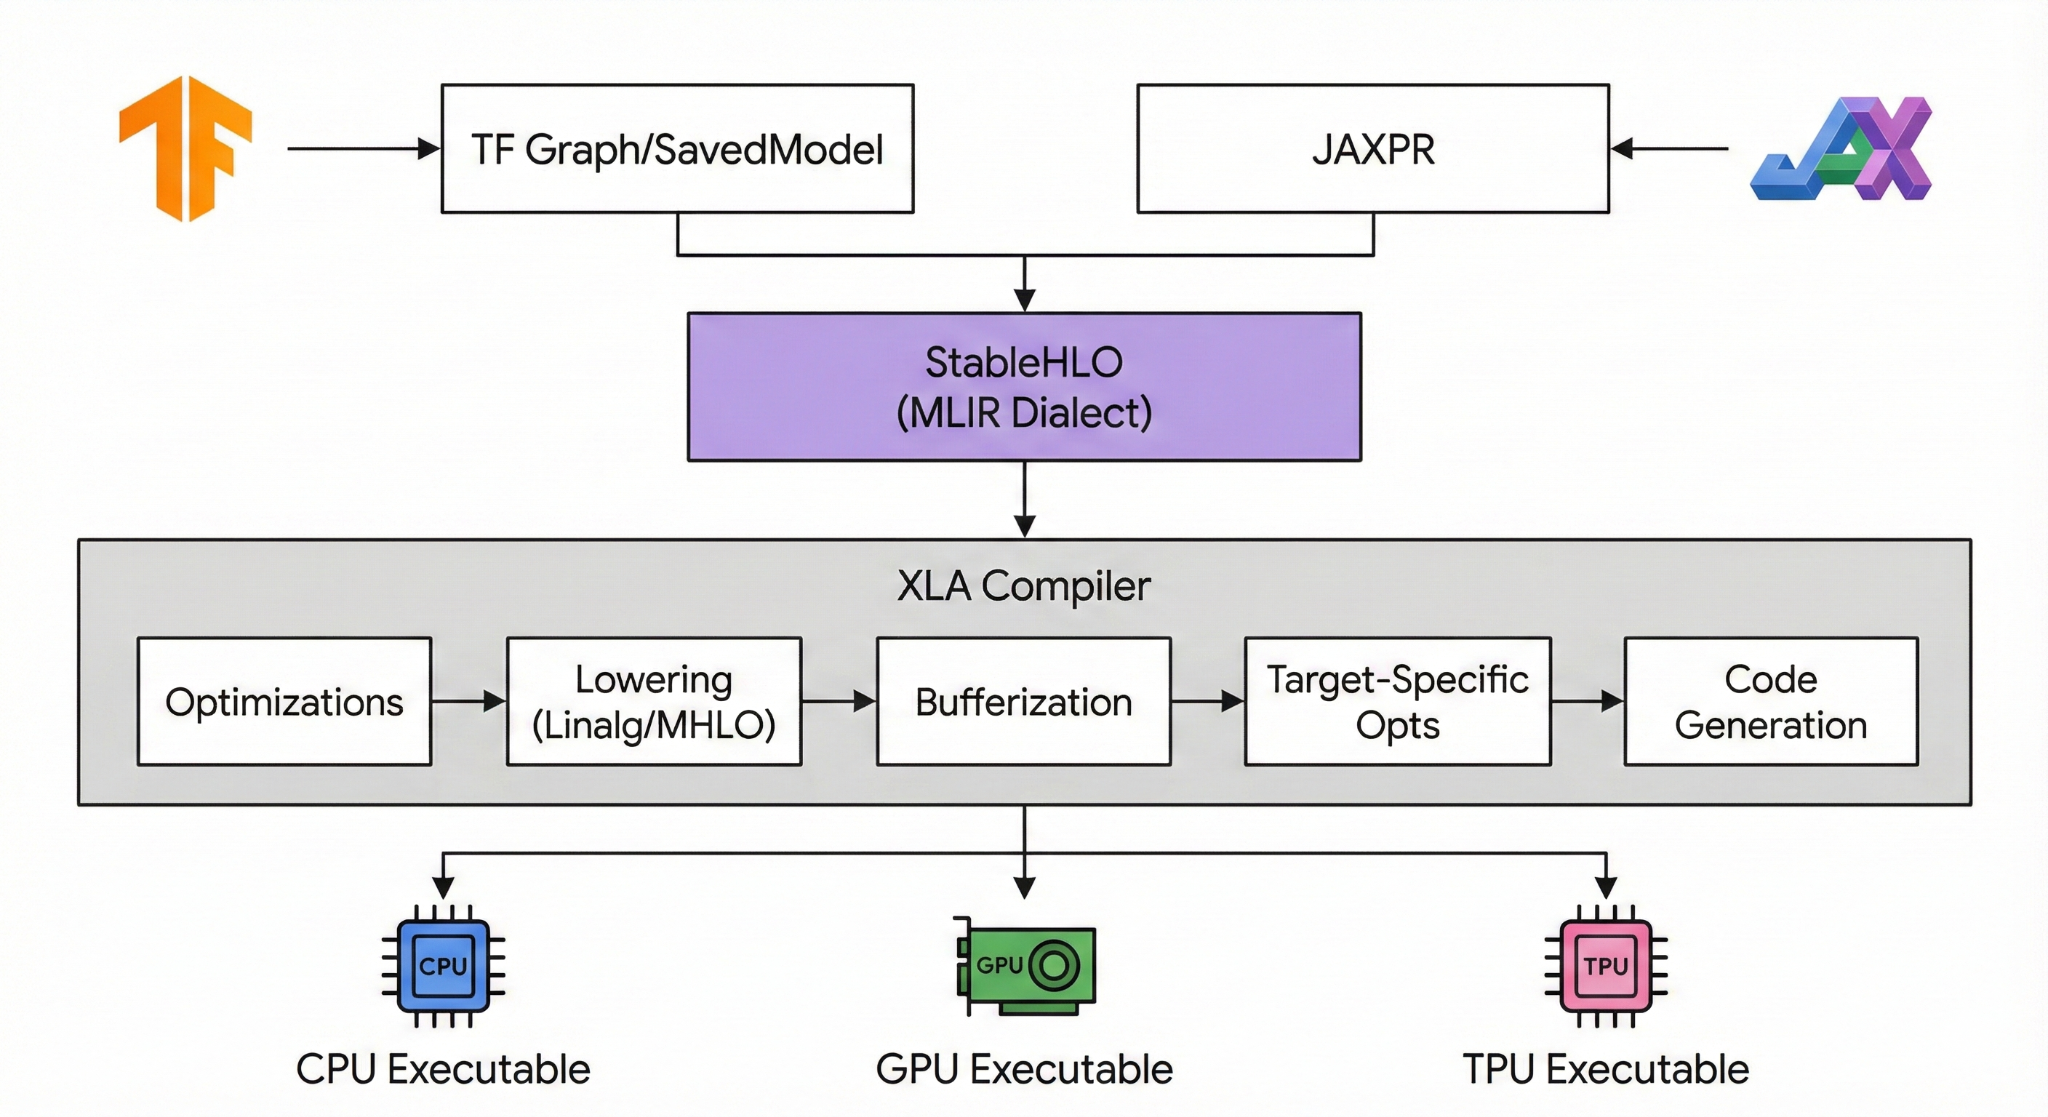
MLIR (Multi-Level Intermediate Representation) solves this by providing a unified infrastructure. It allows compilers to define “dialects”—modular levels of abstraction that can mix and match. It serves as the backbone for modern machine learning compilers like XLA (used by TensorFlow, JAX, and PyTorch).
When you write code in JAX, it doesn’t go straight to machine code. It gets lowered into the StableHLO dialect, then usually to the Linalg or Affine dialects, and finally to LLVM IR or NVVM for hardware execution.
Because MLIR sits right in the middle of this pipeline, it is the critical path for performance. If an MLIR pass handles a loop inefficiently, the final application runs slowly, regardless of how fast the hardware is.
The Problem: Correctness vs. Performance
Most compiler testing focuses on correctness. We run fuzzers to answer the question: “Does the compiler crash, or does it produce the wrong number?”
However, in High-Performance Computing (HPC), a program that produces the right answer but takes 10x longer to run is effectively broken. These are Silent Performance Regressions. They are dangerous because they don’t throw errors; they just silently degrade the efficiency of the underlying hardware.
Detecting them is hard. To test correctness, you just need to check the output. To test performance, you typically need an “oracle”—you need to know exactly how fast the code should run. For random, generated test cases, calculating that theoretical speed is impossible.
I recently built a framework to automate performance testing for MLIR without needing a ground-truth oracle.
The Approach: Metamorphic Testing Relations and Tools
Since we can’t predict absolute performance for random inputs, we look at relative performance using Metamorphic Testing. I defined three Metamorphic Relations (MRs) that a healthy MLIR compiler should satisfy, utilizing specific tools to define the expected performance behaviors.
1. Polyhedral Optimization Relation (via Polygeist)
- Relation: Code optimized with polyhedral techniques should outperform a standard scalar CPU baseline.
- The Tool: To define the optimized baseline, I used Polygeist.
- Why: Standard compilers often struggle to automatically identify complex loop optimizations like tiling, parallelization, and fusion in scientific code. Polygeist uses the polyhedral model—a mathematical framework for analyzing loop nests—to automatically apply these advanced transformations. It lowers code to MLIR’s Affine dialect, representing a “best-case” scenario for CPU execution that the standard pipeline should aim to match.
2. Semantic Equivalence Relation (via DialEgg)
- Distributivity (Factorization): Optimizes two matrix multiplications sharing a common operand.
- Original: $D = (A \cdot B) + (A \cdot C)$ (Cost: $\approx 2N^3$)
- Rewritten: $D = A \cdot (B + C)$ (Cost: $\approx N^3$)
- Benefit: Halves the dominant operation count.
- Associativity Reordering: Optimizes chain multiplication based on dimension sizes.
- Original: $D = (A \cdot B) \cdot C$
- Rewritten: $D = A \cdot (B \cdot C)$
- Benefit: The compiler should choose the order that generates the smallest intermediate matrix, minimizing FLOPs.
- Diagonal Scaling: Detects when a matrix multiplication is actually a scaling operation.
- Original: $D = A \cdot \text{diag}(v)$
- Rewritten: $D_{ij} = A_{ij} \cdot v_j$
- Benefit: Reduces complexity from cubic $O(N^3)$ to quadratic $O(N^2)$.
3. Hardware Offloading Relation
- Relation: For sufficient workloads, running on a GPU should be faster than a CPU. This tests the compiler’s ability to effectively lower StableHLO to NVVM (NVIDIA’s IR) versus LLVM CPU code.
Input Generation: The “Compute-Bound” Requirement
Generating valid inputs for performance testing is significantly harder than for crash testing.
For the hardware relation (Time(GPU) < Time(CPU)) to hold true, the input program must be computationally heavy. If a program is memory-bound (spending all its time moving data rather than calculating), the GPU’s massive parallelism provides no advantage, and the overhead of moving data across the PCIe bus actually makes the GPU slower.
This requirement disqualified standard random code generators, which often produce “spaghetti code” with low arithmetic intensity.
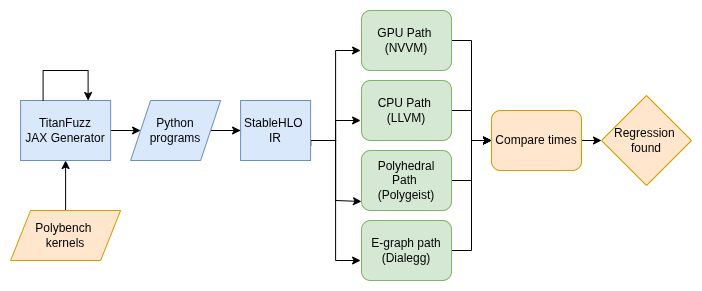
Why PolyBench? I chose the PolyBench benchmark suite as the source of my inputs. PolyBench consists specifically of dense linear algebra kernels (like Matrix Multiplication and solvers) that have high arithmetic intensity. These are exactly the types of programs where a GPU should beat a CPU.
Why TitanFuzz? I extended TitanFuzz, an LLM-based fuzzer, because it supports seed-based generation. Unlike pure random generation, TitanFuzz allowed me to feed in the high-quality PolyBench kernels as seeds. The LLM could then mutate these seeds to create new test cases while preserving the underlying computationally heavy structure required for meaningful performance comparisons.
Results and Findings
I evaluated the framework on 45 computational kernels. The data highlighted both successes and failures in the current MLIR ecosystem.
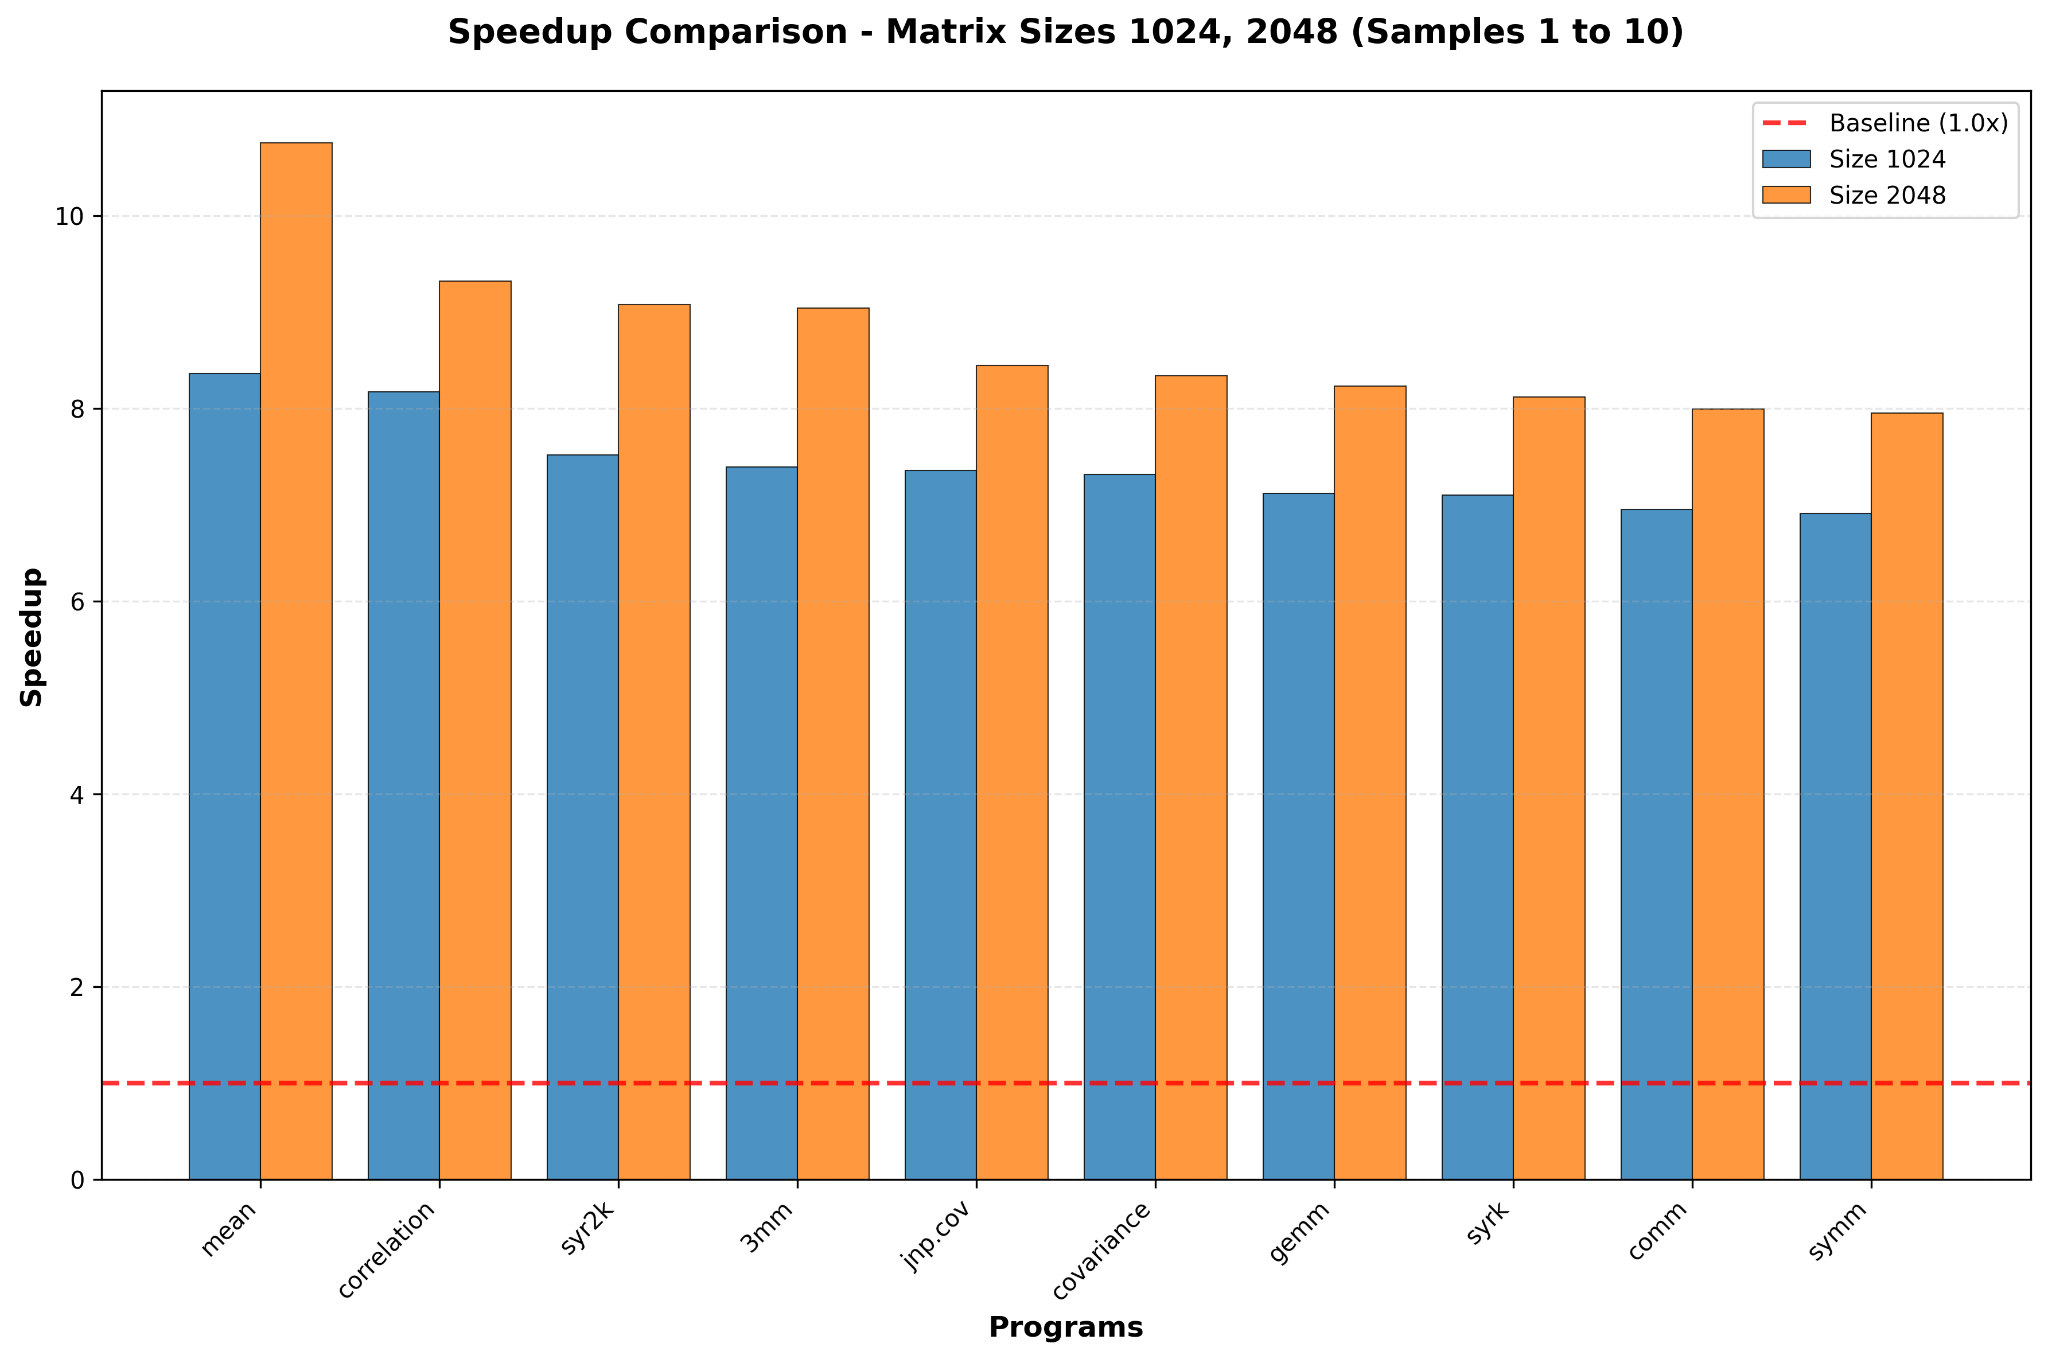
1. Polyhedral Optimizations are Consistent
The relation Time(Polygeist) < Time(Baseline) held up well. Using Polygeist to raise code to the Affine dialect consistently improved performance.
- Results: Speedups ranged from 1.50x (for
atax) to 8.45x (for3mm), confirming that the polyhedral path is stable.
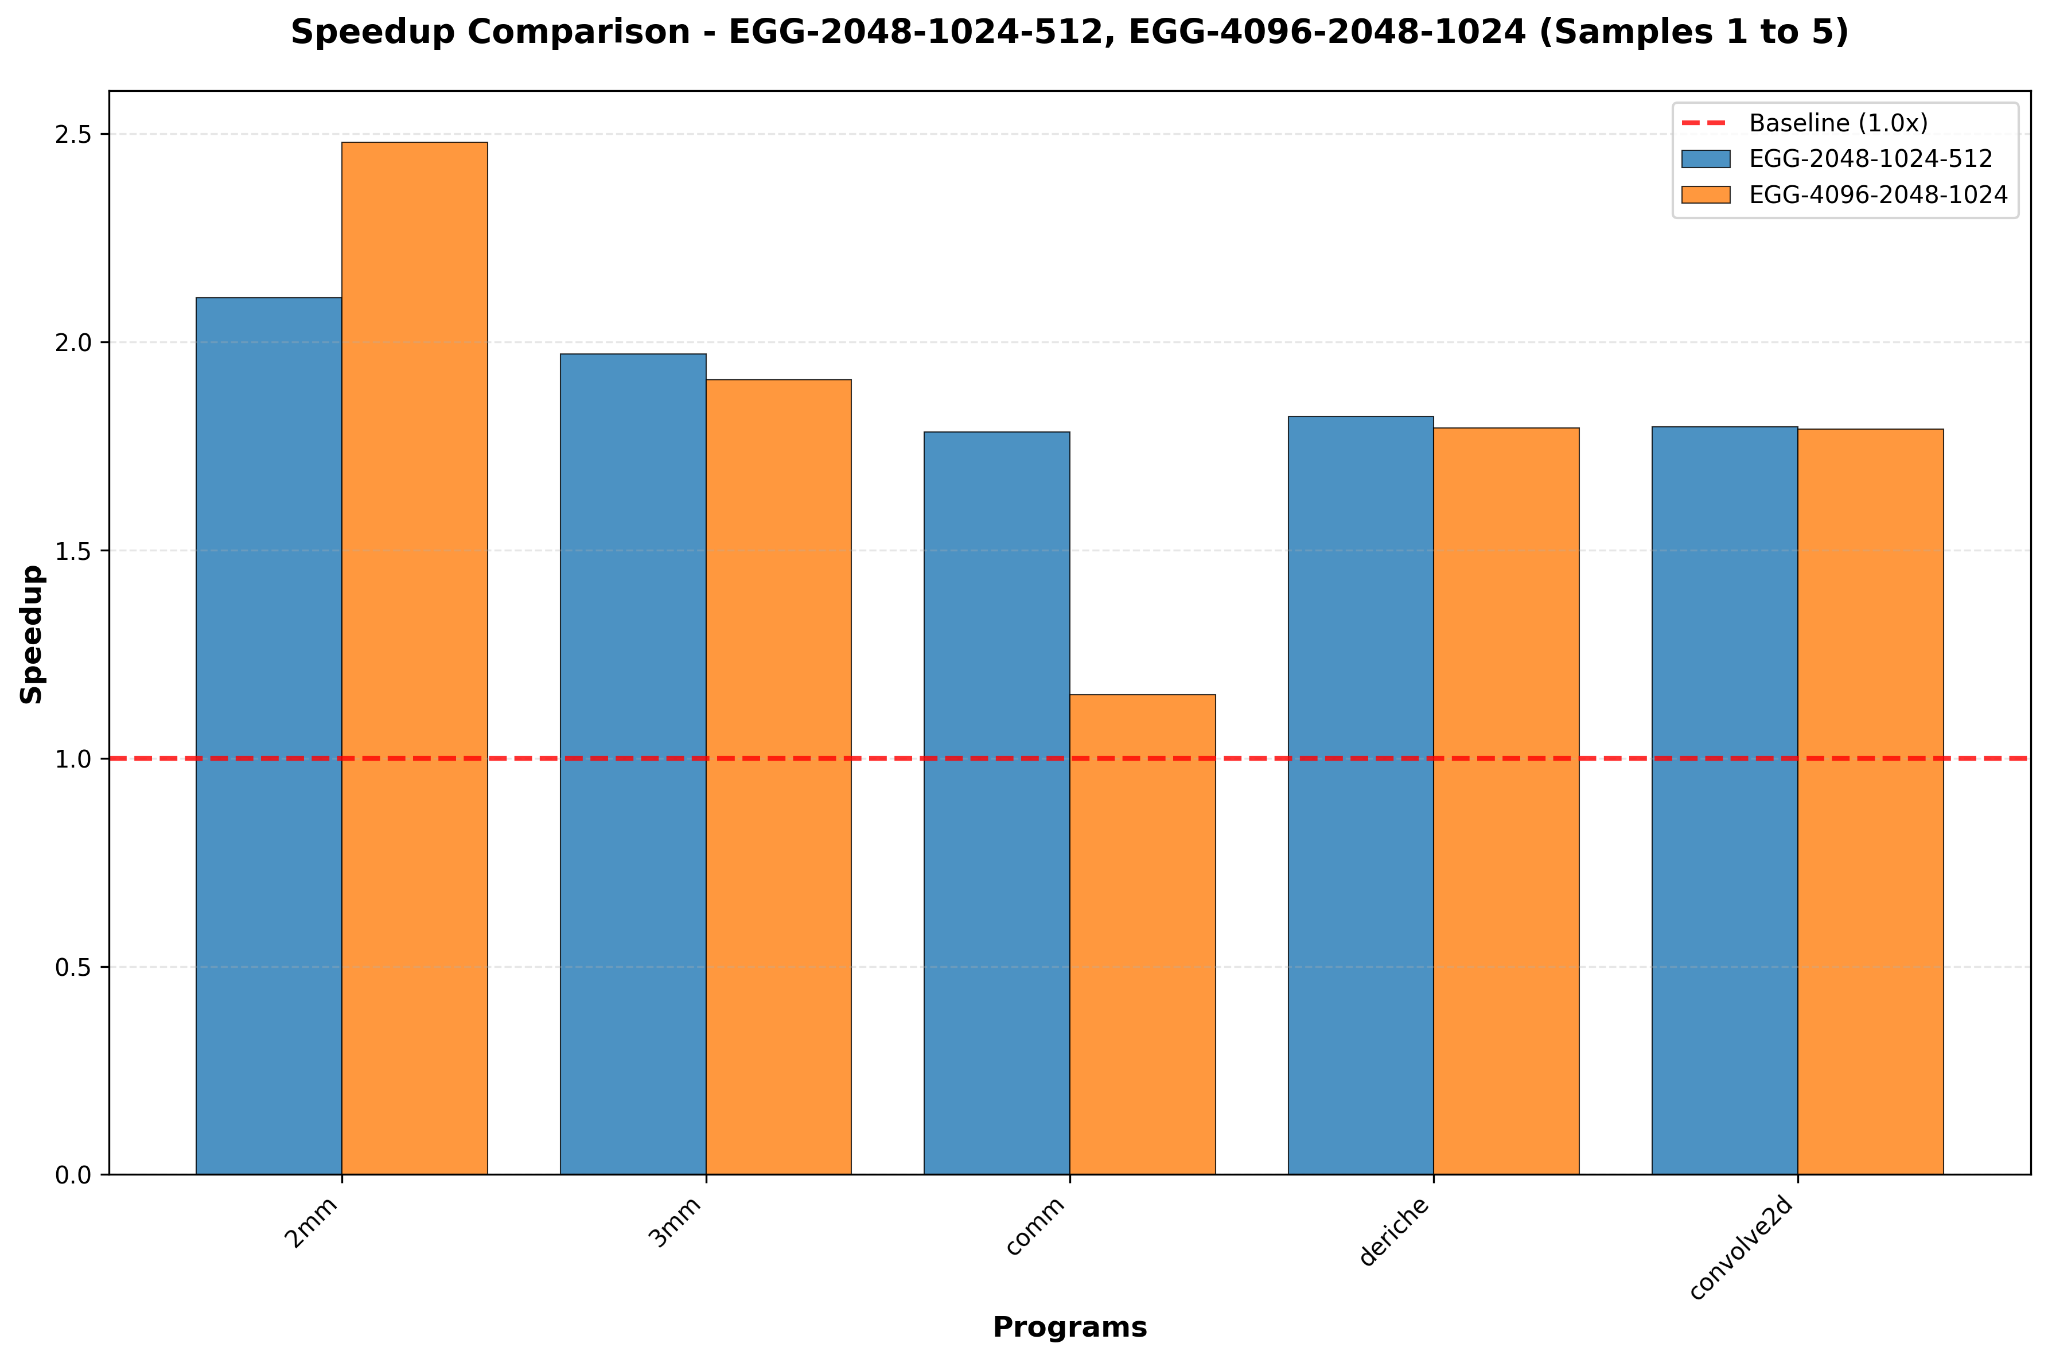
2. Semantic Rewrites Work The relation based on DialEgg rewrites also passed consistently.
- Results: The tool successfully optimized complex expressions, yielding speedups between 1.15x and 2.48x.
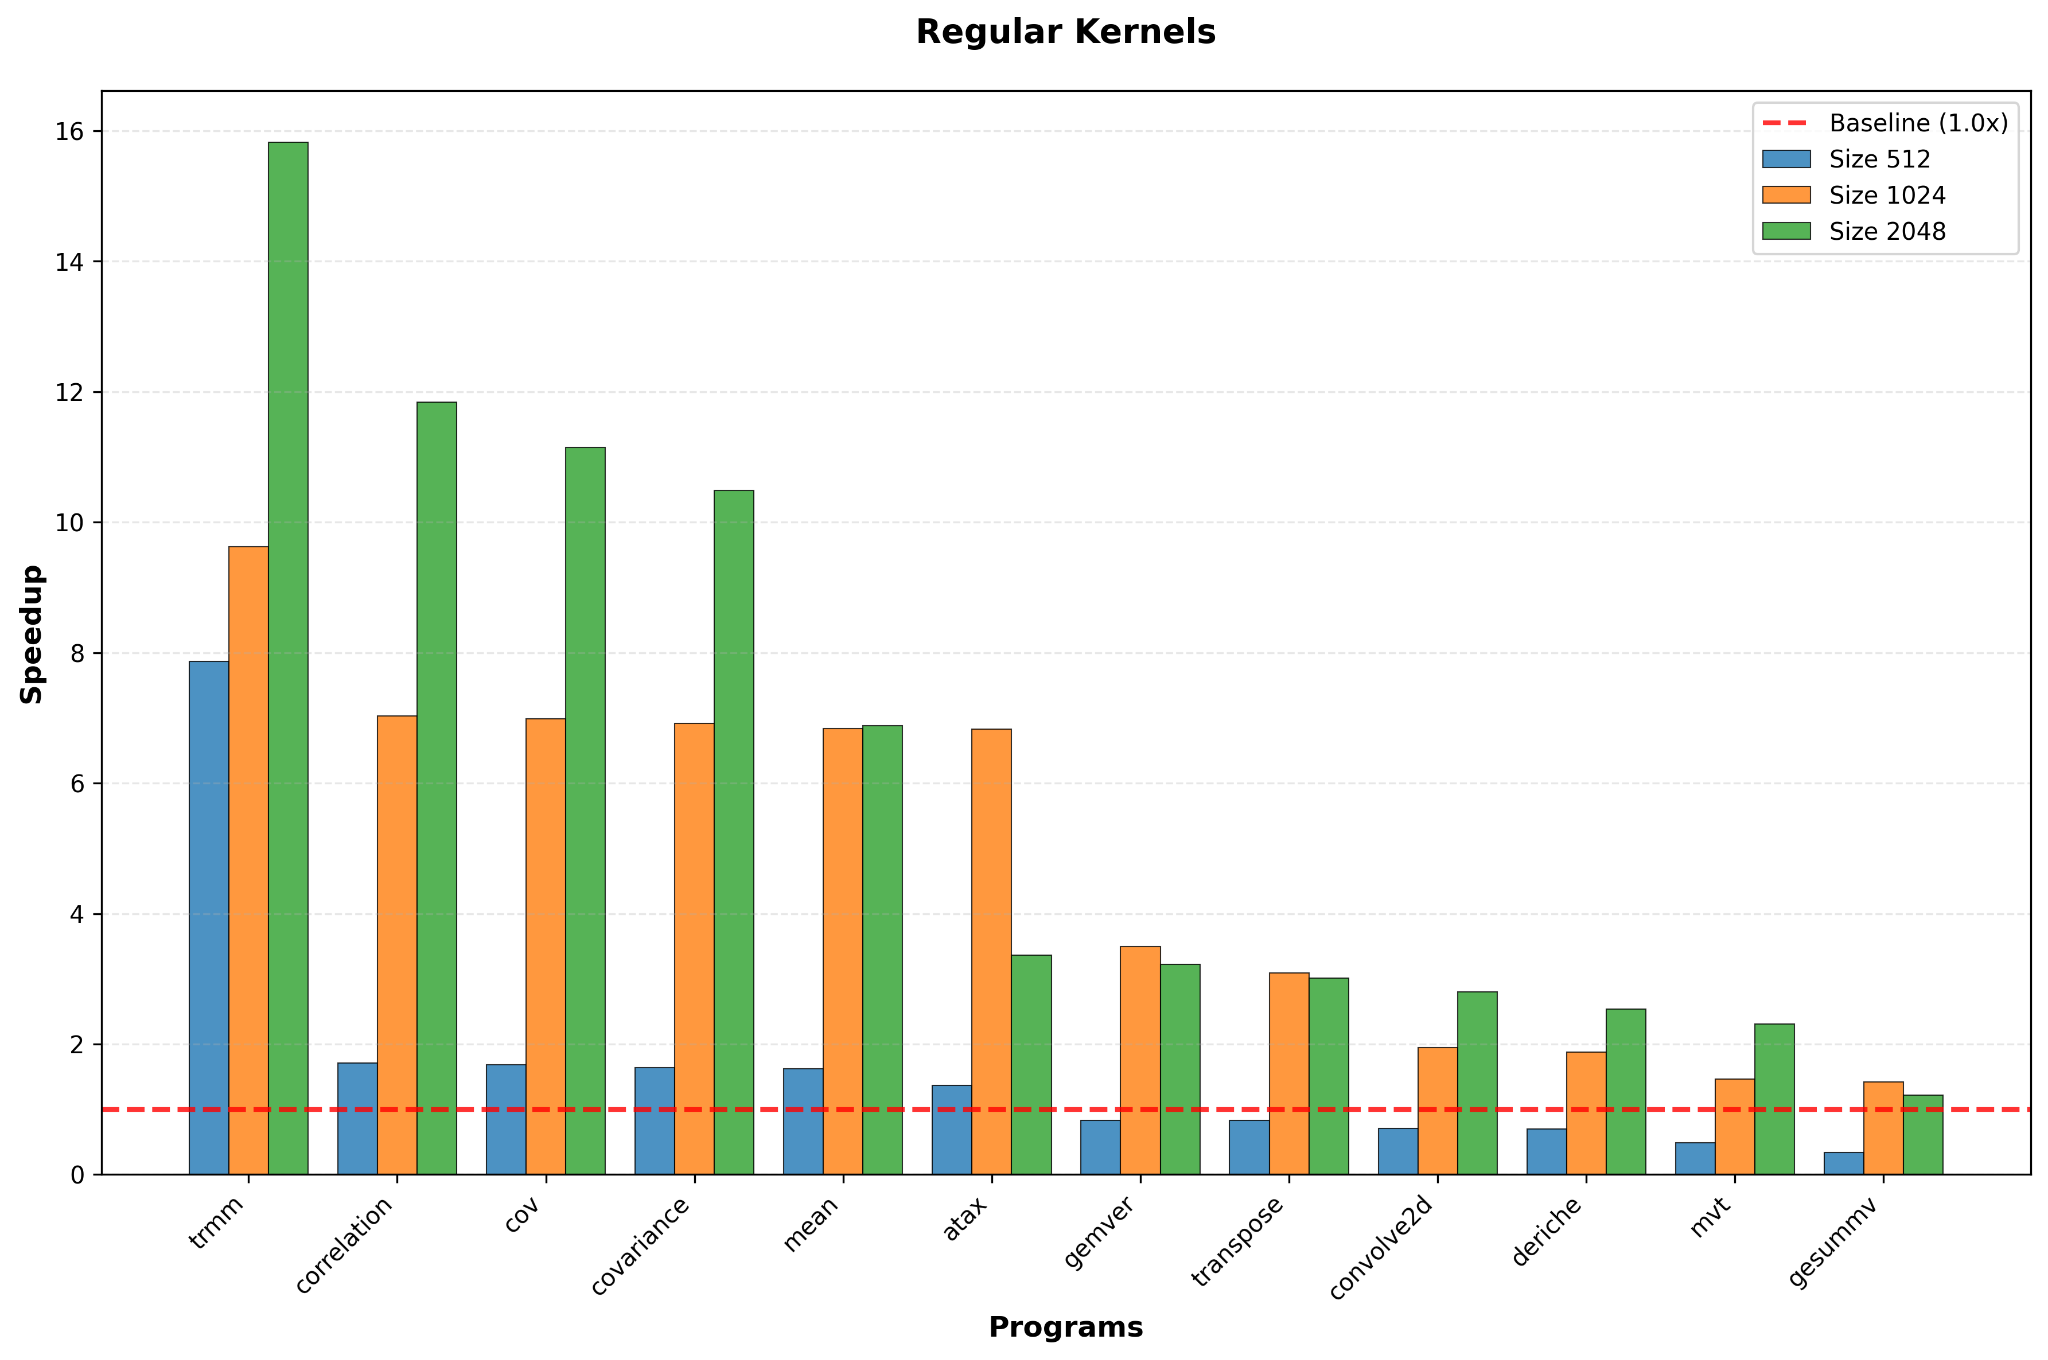
3. The GPU “Crossover” Issue
The hardware relation (Time(GPU) < Time(CPU)) revealed a significant limitation in simple performance testing.
We found that we cannot simply assert that the GPU is faster. The relationship is strictly dependent on the Input Size ($N$).
- At $N=2048$ (Large): The GPU path was massively faster. Compute-bound kernels like
commsaw speedups of 49.72x. - At $N=512$ (Small): The GPU path often failed. The
gesummvkernel ran at 0.67x speed (a 33% slowdown) compared to the CPU.
Summary and Future Work
This project demonstrates that we don’t need a theoretical oracle to find performance bugs. However, the results from the GPU experiments show that a simple “GPU > CPU” rule is insufficient.
To make this test robust, we need to calculate the Crossover Point.
We cannot blindly check if the GPU is faster. We need a mathematical equation—likely based on the kernel’s Arithmetic Intensity (FLOPs per byte) and the hardware’s data transfer bandwidth—to predict the minimum input size $N$ required to hide the latency overhead.
Implementing this cost-model equation into the testing framework is the next step. It would allow the test to automatically skip the “GPU vs CPU” check for small inputs where the CPU is expected to win, preventing false positives and focusing the test on genuine regressions at scale. You can find the source code and the paper of this project here.